Posted By: technopediasite
Chromatic Dispersion (CD) is caused by the variation of the fiber’s refraction index with the wavelength. This generates varying delay between wavelengths and appears to broaden the transmission pulse as it travels along the fiber. This in turn results in distortion and increases the Bit Error Rate (BER) of the optical system. As a result, a link distance limit is created for a given transmission bit rate, and, for dispersion shifted fiber, unequal channel
Test Conditions
In order to know which formula shall be applied, a rule of thumb shall be the following:
Chromatic dispersion measurements are typically performed unidirectionally.
The instrument shall have a higher dynamic range than the link itself. A 35dB dynamic range is usually enough for most of the applications, while 45dB range is required for very long distance measurements. The wavelength measurement range shall be between 1255 nm and 1650 nm in order to fully characterize the fiber.
Recommended Equipment
• MTSe with 5083 CD module and associated optical connector
• Optional 0 dB termination connector if end connectors are not reflective
• Visual fault locator option with associated optical connector
• Fiber scope with associated optical connector
• Cleaning kit
• Jumpers with associated optical connectors
• Pigtails with temporary joiners if the link is not connectorized
• Communication tool (either GSM or telephone, or SMS, or optical talk set)
Test Methodology
Perform the following steps prior to making the specified measurement:• Clean the OTDR front connector with the fiber cleaning kit and inspect the port with a fiber
scope.
• Clean the jumpers and the patch panel connectors
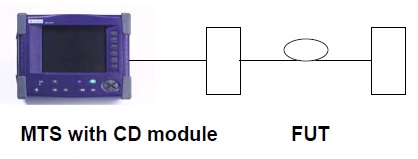
• Connect the OTDR to the link
• If you have multiple modules installed, press “Set-Up” and “Instrum. Set-Up” and select the
CD function.
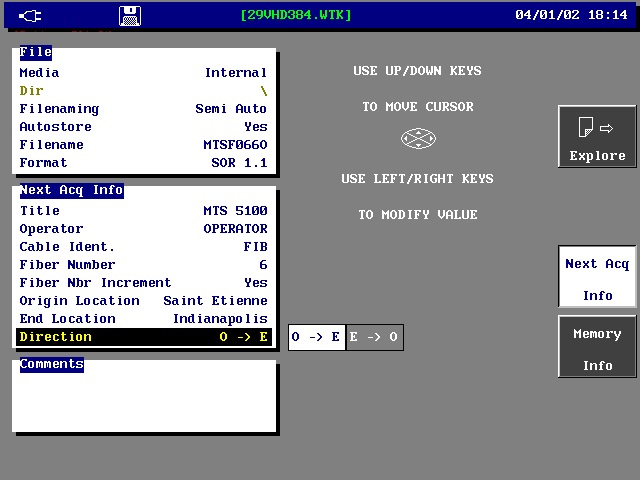
• Select a pre-defined company macro under “Set-Up” key. If there is no macro, then press
“file” key in order to enter information about the cable under test and the directory where to
store the traces. Autostore, auto fiber number increment and autofilenaming shall be
selected.
• If there is no macro, for a simple acquisition, press “Set-up” key and select “Test Auto”
➤ Select the approximation formula according to the fiber under test, following the table above and its rule of thumb.
➤Press “Start” key to perform the first fiber acquisition. Without macro, the unit will try to find the best configuration for the link. Once the user consider this configuration as correct, then he shall press the “Set-up” key and select the manual mode, so that all tests will have the same configuration. Expert people can also use the manual mode for optimization.
➤Four traces are then displayed with four Fresnel which correspond to the fiber end.
➤Select “Dispers.” to get the dispersion trace.
➤Select “Add Slope” to display the slope figures if necessary.
• Select ‘Delay” to get the delay trace if necessary.
• Press the “file” key and store the results.
• Repeat the “start” (or “fast” with Macro) process for the full cable
• Transfer the files using FiberCable and print the results and traces
There is one typical ‘abacus’ available, which could be used to provide the delay limit according to the transmission bit rate per channel. As a rule of thumb the dispersive broadening generated by the chromatic dispersion delay should not exceed 0.306 times the NRZ timeslot:
A similar abacus is also provided by ITU standards, giving maximum distances for different transmission bit rates and fiber types, and at around 1550 nm:
Another abacus is providing the maximum allowable accumulated chromatic dispersion for a 1 dB penalty as a function of bit rate (R, given in Gbit/s). This is approximated by the following formula: D < 105/R2.
Chromatic Dispersion (CD) is caused by the variation of the fiber’s refraction index with the wavelength. This generates varying delay between wavelengths and appears to broaden the transmission pulse as it travels along the fiber. This in turn results in distortion and increases the Bit Error Rate (BER) of the optical system. As a result, a link distance limit is created for a given transmission bit rate, and, for dispersion shifted fiber, unequal channel
spacing around 1550nm is imposed in order to avoid fiber non-linearities such as four wave mixing.
It is critical to know what are the limits of the link in this respect. The dispersion response of
different fiber types is shown in the diagram below:
 |
| Dispersion Diagram |
Test Conditions
There are different methods of measuring CD. All the methods are essentially delay measurements at different wavelengths, and, from those measurements, are calculations of the delay for the other wavelength using a numerical fitting algorithm. From the resulting delay trace, the dispersion coefficient and the dispersion slope as a function of wavelength are then provided. Different ‘fits’ are used according to the fiber under test, as shown in the table below:
 |
| Different ‘fits’ are used according to the fiber under test |
➤If the dispersion trace has a zero dispersion value around 1300nm, then the fiber
corresponds probably to ITU-T G.652 standard and the corresponding fitting shall be
applied
➤If the dispersion trace has a zero dispersion value around 1550nm, then the fiber
corresponds probably to ITU-T G.655 standard and the corresponding fitting shall be
applied (very few G.653 fibers have been installed worldwide).
With the OTDR method, the backscattered time difference (time delay) between the different
wavelengths at the beginning of the link is measured. The chromatic dispersion of the tested fiber is then calculated using the defined fitting algorithm for the fiber type under test.
 |
| unidirectionally |
The instrument shall have a higher dynamic range than the link itself. A 35dB dynamic range is usually enough for most of the applications, while 45dB range is required for very long distance measurements. The wavelength measurement range shall be between 1255 nm and 1650 nm in order to fully characterize the fiber.
Recommended Equipment
• MTSe with 5083 CD module and associated optical connector
• Optional 0 dB termination connector if end connectors are not reflective
• Visual fault locator option with associated optical connector
• Fiber scope with associated optical connector
• Cleaning kit
• Jumpers with associated optical connectors
• Pigtails with temporary joiners if the link is not connectorized
• Communication tool (either GSM or telephone, or SMS, or optical talk set)
Test Methodology
 |
| Test Method |
Perform the following steps prior to making the specified measurement:• Clean the OTDR front connector with the fiber cleaning kit and inspect the port with a fiber
scope.
• Clean the jumpers and the patch panel connectors
• Connect the OTDR to the link
• If you have multiple modules installed, press “Set-Up” and “Instrum. Set-Up” and select the
CD function.
• Select a pre-defined company macro under “Set-Up” key. If there is no macro, then press
“file” key in order to enter information about the cable under test and the directory where to
store the traces. Autostore, auto fiber number increment and autofilenaming shall be
selected.
 |
| “Set-up” key and select “Test Auto” |
 |
| Test method |
➤ Select the approximation formula according to the fiber under test, following the table above and its rule of thumb.
➤Press “Start” key to perform the first fiber acquisition. Without macro, the unit will try to find the best configuration for the link. Once the user consider this configuration as correct, then he shall press the “Set-up” key and select the manual mode, so that all tests will have the same configuration. Expert people can also use the manual mode for optimization.
➤Four traces are then displayed with four Fresnel which correspond to the fiber end.
➤Select “Dispers.” to get the dispersion trace.
➤Select “Add Slope” to display the slope figures if necessary.
 |
| “Add Slope” |
• Press the “file” key and store the results.
• Repeat the “start” (or “fast” with Macro) process for the full cable
• Transfer the files using FiberCable and print the results and traces
There is one typical ‘abacus’ available, which could be used to provide the delay limit according to the transmission bit rate per channel. As a rule of thumb the dispersive broadening generated by the chromatic dispersion delay should not exceed 0.306 times the NRZ timeslot:
 |
| Chromatic dispersion delay |
A similar abacus is also provided by ITU standards, giving maximum distances for different transmission bit rates and fiber types, and at around 1550 nm:
 |
| Maximum Dispersion |
 |
| maximum allowable dispersion |


1 Comments
asd
ReplyDelete